“Where does my money go?” is one of the most common money questions there is, and it rarely means anything is badly wrong. It usually means the money left in many small, forgettable pieces: card taps, app charges, deliveries, a renewal you agreed to a year ago. To track where your money goes each month, you need two things: a complete record of what actually left your accounts, and a way of grouping it that makes the big pieces obvious.
This guide gives you a method you can run on the next month, with or without an app, and shows where an expense tracker such as MoneyFlux saves time along the way.
Why money seems to disappear by month-end
A few patterns explain most of the “it just vanished” feeling:
- Small purchases don’t register. A single coffee or taxi feels like nothing. Thirty of them in a month are a real line item, but you never see them added up.
- Payments are invisible. Cards, phones and saved payment details remove the moment of handing over money. Subscriptions and in-app charges don’t require any action at all.
- Irregular costs feel like surprises. An annual renewal, car service or a birthday gift is predictable over a year but lands in one month as a shock.
- Money moves between your own accounts. Transfers to a savings account, a second card or a friend you lent money to make one balance shrink without any spending taking place.
None of this is visible from a bank balance. You need the transactions.
Step 1: Collect one complete month of transactions
The method only works with complete data. A list written from memory always misses the small stuff, which is exactly the part you are looking for.
- Export a statement for every card and account you used during the month. Most banks offer a CSV, a PDF statement, or an OFX/QFX file. If you use MoneyFlux, you can import the bank statement instead of typing each expense; duplicates are skipped if the periods overlap.
- Add cash spending. Cash never appears on a statement. If you withdrew 200 and can’t account for it, record it as one cash expense rather than leaving a hole.
- Mark transfers as transfers. Moving money to your own savings or another card is not spending. Keeping it separate stops your totals from being inflated.
- Note money you lent. Lending a friend money feels like spending at the time, but it’s a loan you expect back, so record it as one rather than as an expense. The guide to keeping track of money you lent to friends shows how to log it and the repayments.
Choose a calendar month or the month from payday to payday, whichever matches how you think about money, and stick with it.
Step 2: Split fixed costs from flexible spending
Before looking at categories, divide the month into two piles:
| Fixed (same amount, hard to change quickly) |
Flexible (varies, decided day to day) |
| Rent or mortgage |
Groceries |
| Utilities and phone |
Restaurants, cafes, delivery |
| Insurance, loan payments |
Taxi and ride-hailing |
| Childcare, school fees |
Shopping, clothing, electronics |
| Subscriptions you actively use |
Entertainment, hobbies, gifts |
Fixed costs are rarely the mystery; you know roughly what rent is. The question “where did it go” is almost always answered by the flexible pile. That’s where to spend your attention.
Step 3: Rank categories, then look at merchants
Group the flexible spending into categories and sort them from largest to smallest. Most people find that two or three categories account for the bulk of it.
Category totals alone stop short, though. “Restaurants: a large share of the month” doesn’t tell you what to look at. The useful question is which merchants make up that category:
- Is it one place you visit daily, or a long tail of different places?
- Is it delivery fees on top of food?
- Is “Shopping” really one big purchase that won’t repeat, or ten medium ones that will?
Merchant names are what turn a vague category into something you can recognize and act on.
How MoneyFlux shows this
The Analytics screen in MoneyFlux shows one period at a time, in Week, Month, Quarter or Year ranges, with three views: Expenses, Income and Net. In the Expenses view you get the period total, a category donut you can tap to isolate a single category, and your top merchants for the period. Account chips narrow everything to one card if you want to see a single account. This single-period view is free.
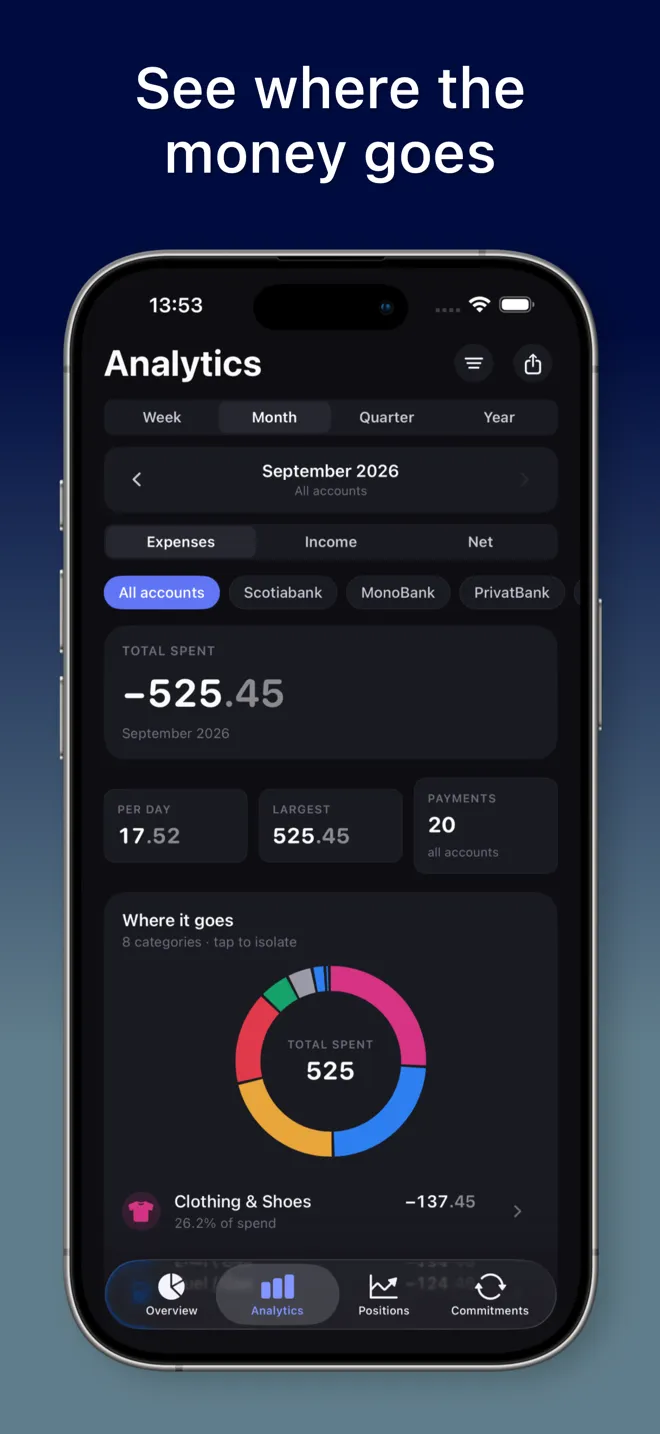
With Premium, you can open a category to see its trend, its share of spending, the top merchants inside it and the latest transactions, and a daily heatmap shows which days of a month cost the most. The Analytics section on the features page lists every chart.
Step 4: Find the recurring leaks
Once categories and merchants are in front of you, look specifically for spending that repeats without a decision each time:
- Subscriptions for streaming, cloud storage, apps, gyms and news. Check each one against how often you actually used it this month.
- Annual renewals. These are the easiest to forget because they appear once a year. A statement from the renewal month shows them; a single “normal” month does not.
- Price changes. A subscription that quietly costs more than when you signed up still looks familiar on a statement, so compare the amount with what you remember agreeing to.
- Repeated small purchases at the same merchant: daily coffee, lunch near the office, convenience-store stops. Individually trivial, together often one of the larger flexible lines.
- Fees. Card fees, delivery fees, late fees, currency fees from your bank.
In MoneyFlux, Analytics also lists subscriptions due in the next 30 days. If you want every recurring payment in one list with monthly and annual totals and a reminder before each charge, that’s the Commitments tab in Premium; the guide to tracking subscriptions and recurring payments covers it in detail.
Step 5: Compare the month with the previous one
A single month can mislead. A month with a holiday, a car repair or a big household purchase will look alarming, and a quiet month will look better than your real average.
Before drawing conclusions:
- Put the same categories for two or three months side by side. Look for categories that grew, not just ones that are large.
- Separate one-offs from patterns. A new laptop is a one-off. Delivery doubling over three months is a pattern.
- Check income too. If income dropped, the month will feel tight even if spending stayed flat. The Net view puts income and expenses together so you can see the gap.
In MoneyFlux you can step back through earlier periods on the free plan. Premium adds a side-by-side comparison with the previous period, plus filters by currency, amount range and tags, so a category that grew stands out without arithmetic.
If you hold money in more than one currency, compare each currency on its own. MoneyFlux groups totals per currency and does not convert between them, so hryvnias and Canadian dollars are never mixed into one misleading number. The post on tracking expenses in several currencies explains why.
Step 6: Pick one change and check next month
The point of all this is not a perfect spreadsheet. It’s to replace the vague feeling with one or two concrete facts, such as “delivery is my third-largest category” or “I pay for three streaming services and use one.”
From there, the decision is yours. Some people cancel a subscription, some set a rule for a single category, some simply keep watching. Whatever you choose, run the same method next month and see whether the category moved. A tracker is useful because it makes that second look cheap.
If you are trying to set money aside, MoneyFlux lets you set a savings target as a percentage of income in Settings, and the Net view shows your savings rate against it each period. Savings goals, which are free, keep money you put aside visible instead of letting it look like spending.
Try it in MoneyFlux: import last month’s card statement, add your cash spending, then open Analytics, choose Month, and tap the largest slice of the donut to see which category took the most.
Doing this without an app
You can run the whole method in a spreadsheet: export statements, paste them into one sheet, add a category column, and build a pivot table by category and merchant. It works, and it’s free. The cost is time: cleaning column formats, removing duplicates when statements overlap, and recategorizing the same merchants every month. If you’re weighing the two options, the comparison of a budget spreadsheet vs an expense tracker app goes through the trade-offs honestly.
Either way, the principle is the same: real transactions, a full month, grouped by category and merchant, compared with the month before. Once you have that, “where does my money go” stops being a mystery and becomes a short list you can actually do something about.
Frequently asked questions
Why do I never know where my money goes?
Usually because card purchases are small, frequent and paid without cash changing hands, so none of them feels significant. Totals only become visible when every transaction for a month is collected and grouped.
How do I track where my money goes without typing every purchase?
Download your bank statements and import them into an expense tracker that reads them, then add cash by hand. In MoneyFlux you review the imported rows before they are saved, and duplicates are skipped.
How many months should I look at?
One full month shows the pattern; two or three months show whether it was a typical month. Irregular costs such as annual subscriptions or insurance only appear when you look further back.
Is the Analytics screen in MoneyFlux free?
Yes, you can view one period at a time for free: expenses, income and net, the category breakdown and top merchants. Comparing periods, filters, category drill-down and the daily heatmap are part of Premium.
Does this tell me how much I should spend?
No. This method shows what you actually spent so you can decide for yourself. It is not financial advice, and MoneyFlux does not set budgets.