If you follow a Telegram or Discord channel for crypto or forex calls, you have probably asked whether the person behind it is actually any good. Learning how to check a trading signals track record comes down to one idea: the channel’s own feed is not a record, it is a selection. To verify a trading signal provider you have to rebuild the full list of calls yourself, including the losing ones and the ones that quietly never closed, and then do some simple arithmetic on it.
This guide walks through what to log, which numbers to compute, and where the usual distortions hide. None of it needs a paid tool. A spreadsheet works, and so does a trading journal app. Nothing here is investment advice, and nothing here is about any particular channel.
Why a channel’s own results can’t be trusted at face value
Most channels are not lying outright. The problem is that the person posting the results also chooses which results to post, and that choice bends the picture in predictable ways.
Survivorship and selection bias in signal channels
Selection bias is when the sample you see is not the sample that happened. In a signal channel it usually looks like this:
- Winners get a victory lap. A call that hits its target gets a screenshot, a “+180%” and a row of fire emoji.
- Losers get silence. A call that hits its stop is rarely announced with the same energy, if at all.
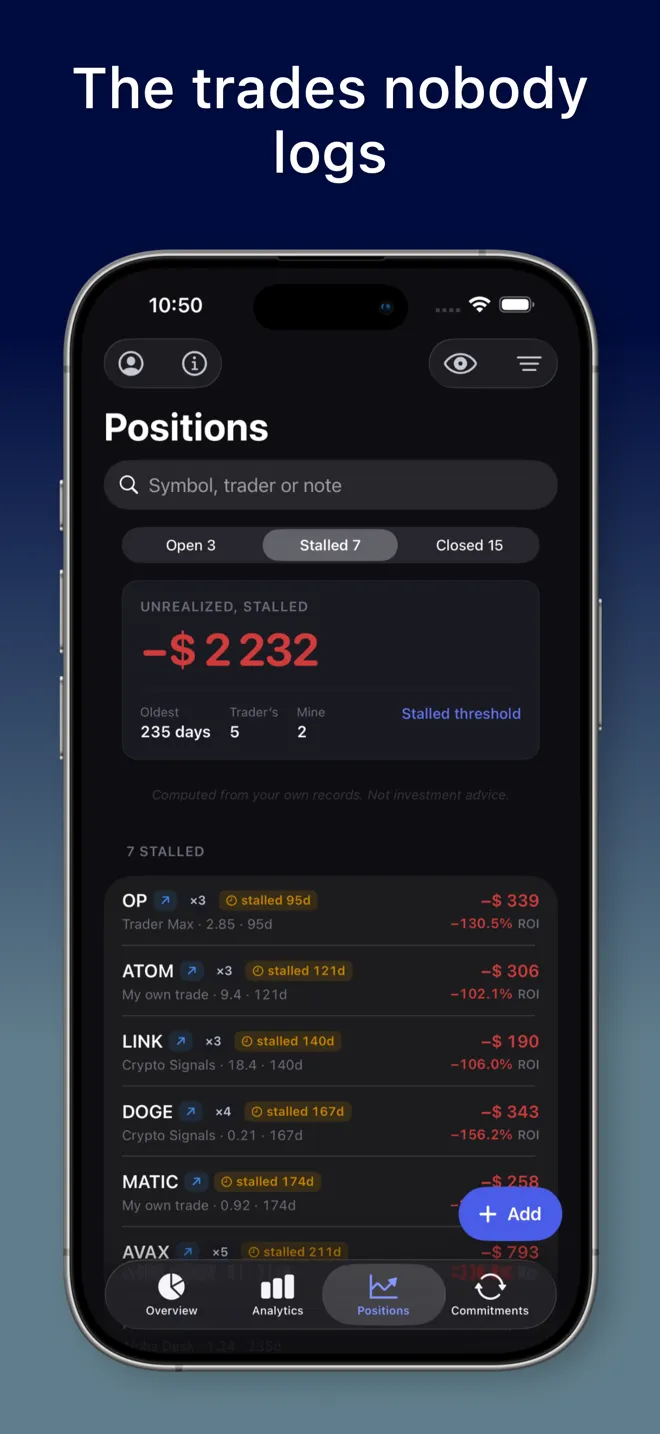
- Stalled calls just fade. A call that went against the trader and never reached the stop often stays “open” forever. Nobody closes it, so it never appears in a monthly recap as a loss.
- Old messages scroll away. By the time you join, the calls from six months ago are a long scroll up, and the recap pinned at the top is the only summary most people read.
Survivorship bias works the same way at the level of whole channels. You hear about the channels that had a good run, not the ones that stopped posting. Neither bias needs anyone to fake anything. It is enough that good news is louder than bad news.
What a verifiable record actually looks like
A record you can check has three properties: every call is there, each call has a timestamp from when it was posted, and each call has a clear ending (target, stop, manual exit or still open). If a channel publishes that itself, good. If it does not, your own log, started on the day you joined, is the only version you can trust.
Step 1: Keep your own trading journal of every call
Start logging today, not after you decide to follow someone. The point is to capture calls before you know how they end, so that the outcome cannot influence what gets written down.
What to record for each call
For every call, write down:
- Date and source. Which channel or trader, and when it was posted.
- Symbol and direction. BTC long, ETH short, and so on.
- Market and leverage. Spot or futures, and the leverage the call suggests.
- Entry, stop and target, exactly as posted.
- What you did. Watching only, entered, or skipped. “Watching” is a perfectly valid answer and it keeps your log honest about calls you did not take.
- The stated result, if the channel later announces one.
- The ending. The exit price and date, or “still open”.
If you entered the trade, also record your own fills, fees and funding. Your result and the trader’s result are different numbers, and you want both.
Why you must log the calls that are still open
This is the part almost everyone skips. A call that has been open for four months is not neutral. Either it is losing and nobody has admitted it, or it is so far from target that it is unlikely to matter. Either way, leaving it out of the record makes the trader look better than the calls actually were.
Step 2: Compare the stated % with what his own prices imply
A stated percentage and the percentage implied by the posted prices are often not the same number, and the difference is not always dishonest. It is still worth knowing.
Recompute every result from entry and exit
Take the entry price from the original call and the exit price from the result post, and compute the move yourself. A simple illustration with made-up numbers:
- The call says: long at 100.
- The result post says: closed at 128, “+140%”.
- The price moved from 100 to 128, which is +28%.
So where does +140% come from? Usually from one of these:
- Leverage. At 5x, a 28% price move is reported as 140% on margin. That is a real number for someone who used 5x, but it is not comparable with a spot call, and the same leverage makes the losers five times worse too.
- A better entry. The result is measured from the bottom of an entry zone you could not have hit.
- The best wick. The exit is the highest price touched, not where most people could have sold.
None of these is necessarily a lie. But a channel that always reports on the most flattering basis is giving you a number you cannot reproduce.
Three numbers for the same call
For each call it helps to keep three separate figures side by side:
| Figure |
Where it comes from |
What it tells you |
| Claimed in the channel |
The trader’s own result post |
The marketing number |
| His own prices imply |
His posted entry and exit |
What the call was actually worth on his own terms |
| You made |
Your fills, fees and funding |
What your money did |
These are three different bases, so don’t add them together. When the first number is regularly much bigger than the second, you have learned something about how the channel reports.
Step 3: Count the win rate twice
Win rate is the headline number every channel likes, and it is also the easiest to distort.
Win rate over closed calls vs counting stalled calls
Say you logged 18 calls from one channel. Twelve of them closed, and nine of those were winners. Six are still open months later, all of them underwater.
- Win rate over closed calls: 9 of 12 = 75%.
- Win rate counting stalled calls as losses: 9 of 18 = 50%.
Same channel, same calls. The first number is the one you will see in a recap post. The second is closer to what following every call would have felt like. Whenever the two numbers are far apart, the stalled calls are carrying the gap.
Pick a stalled threshold and stick to it
You need a rule for when an open call counts as stalled. Common choices are 30, 60, 90 or 180 days with no exit. A scalping channel deserves a short threshold; a swing-trading channel can have a longer one. What matters is that you choose it before looking at the results and apply it the same way to every source.
Step 4: Look at how long winners and losers are held
Holding time is the quiet tell. Compute the median number of days a winning call stayed open, and the same for losing and stalled calls.
A pattern to watch for: winners are closed quickly and announced, while losers and stalled calls stay open far longer. That is consistent with “take profits fast, never admit a loss”, which inflates the win rate without improving results. A median is better than an average here, because one call held for 300 days would wreck an average.
Step 5: Run a fixed-stake curve across every call
The last check answers the question you actually care about: if you had put the same amount into every call, in order, what would have happened?
Why a fixed stake makes sources comparable
Use one fixed virtual stake, for example $100 per call, and apply each call’s result from its own prices. Plot the running total in date order. A fixed stake removes position sizing from the picture, so two channels can be compared on the calls alone.
What the curve shows that a win rate hides:
- Drawdown. The worst dip from a previous high. A 75% win rate with a few large losses can still give a curve that goes nowhere.
- Timing. Whether the good results were one lucky month or spread across the whole period.
- The missing piece. Stalled calls have no exit, so they cannot be placed on the curve. Note how many are left out next to the curve, or the curve will look better than reality.
Compare the trader with yourself
If you entered some calls and skipped others, compare: how many winners did you miss, how many losers did you avoid, and how does your own result compare with blind following? Sometimes the channel is fine and the problem is which calls you picked. Sometimes it is the other way round.
Red flags that don’t need any math
Some warning signs show up before you have enough calls to compute anything:
- Results are posted only as screenshots, never as the original call next to the exit.
- Old calls get edited or deleted.
- Guaranteed returns, “risk-free” calls or pressure to join a paid tier quickly.
- Requests for exchange API keys with withdrawal rights, seed phrases, or money sent to a personal account.
- A recap that lists wins but never states how many calls were made in total.
If you see the last few, you don’t need a scorecard. Leave.
Doing it in a spreadsheet vs a journal app
A spreadsheet can do everything above. You will need columns for every field in Step 1, formulas for the implied percentage, a status column with a stalled rule, and a chart for the fixed-stake curve. It works, as long as you keep it up and the formulas stay right when rows are added. If you already keep your spending in sheets, our comparison of a budget spreadsheet and an expense tracker app covers the same trade-off.
Try it in MoneyFlux: the Positions tab is a trading journal with a trader scorecard built in. Log a trader’s calls (or import your existing sheet as CSV), and the scorecard shows “Claimed in the channel”, “His own prices imply” and “You made” side by side, the win rate counted both ways, median hold for winners vs losers and stalled calls, and a $100-per-call curve. Positions is part of Premium.
The Positions feature in MoneyFlux does the arithmetic from Steps 2 to 5 on your phone, from the numbers you type in. A few honest limits:
- No live price feed. MoneyFlux does not fetch prices or read channels. You enter the calls and fills yourself, and you can type a current price for an open position when you want an unrealized figure.
- The stake is fixed at $100 per call, so curves for different traders stay comparable. There is no setting to change it.
- Below two closed calls, it shows a sentence instead of a chart. A 100% win rate from one trade means nothing.
- Imported spreadsheets carry no money in. A CSV records the calls, not your margin, so returns on your own money stay empty until you add it.
Your records sync to your own private iCloud, where only you can read them. If you also hold crypto outside of trading, it fits alongside your cards and cash as described in tracking cards, cash and crypto in one place.
What a good track record check gives you
After 30 or 40 logged calls you will have something no recap post gives you: every call, its real result on the trader’s own prices, the calls that never closed, and what your money did. That may confirm the channel is worth following. It may show the opposite. Either way, the decision is based on the full record rather than the highlights, and that decision stays yours.